
“Is it worth the wait?”: What’s the ROI for every Magic Kingdom Attraction?
We know that Disney attraction wait times can be…daunting.
Without a FastPass, you could run into a 45, 60, or 90+ minute wait time as you excitedly reach the entrance of your favorite attraction. Not to mention the record-breaking 300+ minute wait times we’ve seen on very special (and luckily rare) occasions. That’s 5 hours of your day, my friends.
As of writing this, we’re seeing relatively lower average wait-times as park capacity remains below 100%, but as things shift back to “normal” and wait times rise again, we can just see the panic spiral unfold:
“Is this worth it?” “Should we come back later?” “Will our other plans be ruined if I commit to this?” “Will my kid (or adult, yes we see you) want to bail halfway through?” “What happens if we need a bathroom break?” “Maybe we should just grab a churro and take in the scenery…”
Look, only you can make the right decision here for yourself, your family, or your friends. Sure, we might see that 95 minute wait time for Seven Dwarfs Mine Train and confidently march into that beautifully-themed queue, humming “Heigh-Ho, Heigh-Ho” to ourselves, but what if we did a little experiment?
What if we turned to science?
Let’s set our warm fuzzy feelings for our favorite Magic Kingdom attractions aside for just a moment. What if we left our fate to the numbers and embraced the math using a simple Return on Investment (ROI) formula?
We could gauge how much of our time spent waiting in line is actually returned by the attraction. Was it an equal exchange, or did we spend too much time waiting when we could’ve stopped by other (maybe lesser) attractions or enjoyed a nice snack and some park ambiance?
Is this a cold-hearted and probably flawed way to rank attractions? Yes. Is it fun to look at numbers? Absolutely. So let’s see what happens!
If our formula is:
(Average wait time / Attraction duration)*100 = Attraction ROI
Then:
A 10-minute wait for a 10-minute attraction would be a 100% ROI. The time we spent waiting was equally returned by the attraction.
And a 30-minute wait for a 10-minute attraction would a 33% ROI. Only one-third of our time was returned by the attraction this time.
But a 5-minute wait for a 10-minute attraction? That’s a 200% ROI. We just doubled our investment, baby!
Simple, straightforward, maybe cold-hearted, but it’s for science, right? Let’s focus on Magic Kingdom attractions this round and see how they hold up.
What’s the ROI for Magic Kingdom attractions?
Any guesses for which attractions had the best ROI and which ones didn’t fare so well? Let’s see if the math says that your favorites are promoted to must-dos (or possibly ones to skip on your next trip).
First, a few caveats:
Average wait time data sourced via https://www.thrill-data.com/waits/park/wdw/magic-kingdom/ (Thank you for the excellent data & graphs!)
Attraction duration data sourced via https://touringplans.com/magic-kingdom/attractions/duration (Also thank you!)
This is a snapshot of a single day of data on June 1, 2021. Wait times wildly shift day to day and sometimes have higher or lower trends on specific days of the week. And as mentioned, we’re looking at wait times during a lower park capacity era, so while wait times may be lower than expected, the relative “demand” of each ride is fairly on-par with full-capacity park times. We definitely plan to loop back later this year to see how things have changed and look at a wider data set, so stay tuned!
And lastly - due to this being written before things fully reopen, there will be Magic Kingdom attractions absent from this list (sorry, Country Bear Jamboree). We’re looking forward to adding those back in later this year.
Now, on with the show!
22. Astro Orbiter (Worst ROI)
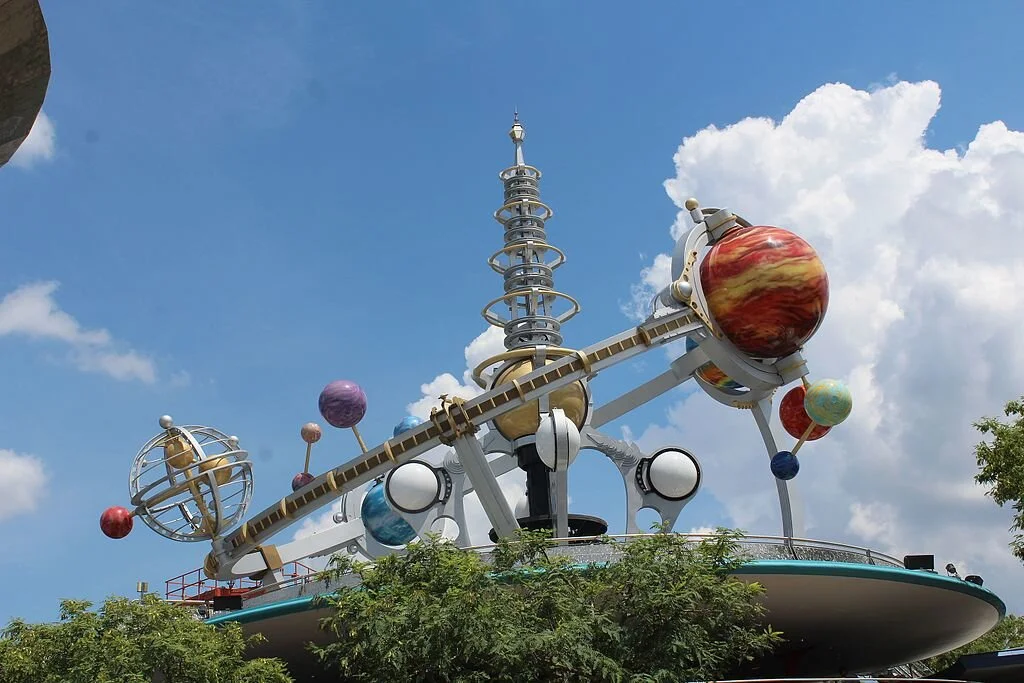
Theme Park Tourist, CC BY 2.0, via Wikimedia Commons
This one honestly surprised us as the worst ROI in the park. It’s not exactly at the top of any of our “must-do” lists (and we admittedly keep forgetting it’s still there right above the PeopleMover). So if you were already planning on skipping this one, just consider this as more fuel for that wise decision!
Average wait time: 30 minutes
Attraction duration: 1.5 minutes
ROI: 5%
21. Seven Dwarfs Mine Train
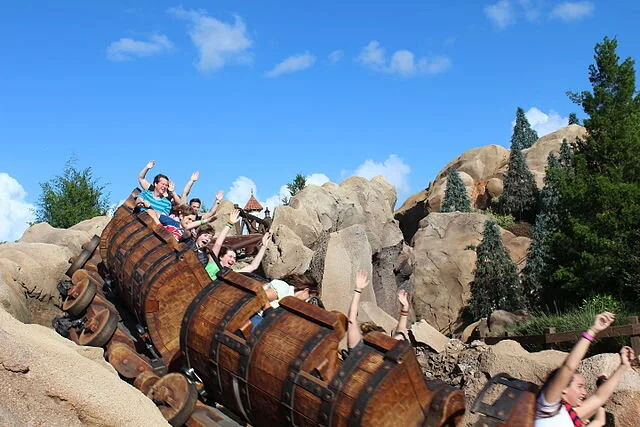
Theme Park Tourist, CC BY 2.0, via Wikimedia Commons
Look, we’re not mad, we’re just…disappointed. Seven Dwarfs Mine Train is known for having notoriously high wait times, so we expected this to have a fairly low ROI, maybe even the worst, but luckily Astro Orbiter softened that blow. We’ll take this as a hint to get that FastPass when they become available again or maybe rope-drop this one (which pains Danielle to say so - she does love her leisurely mornings).
Average wait time: 53 minutes
Attraction duration: 3 minutes
ROI: 5.66%
20. Peter Pan's Flight
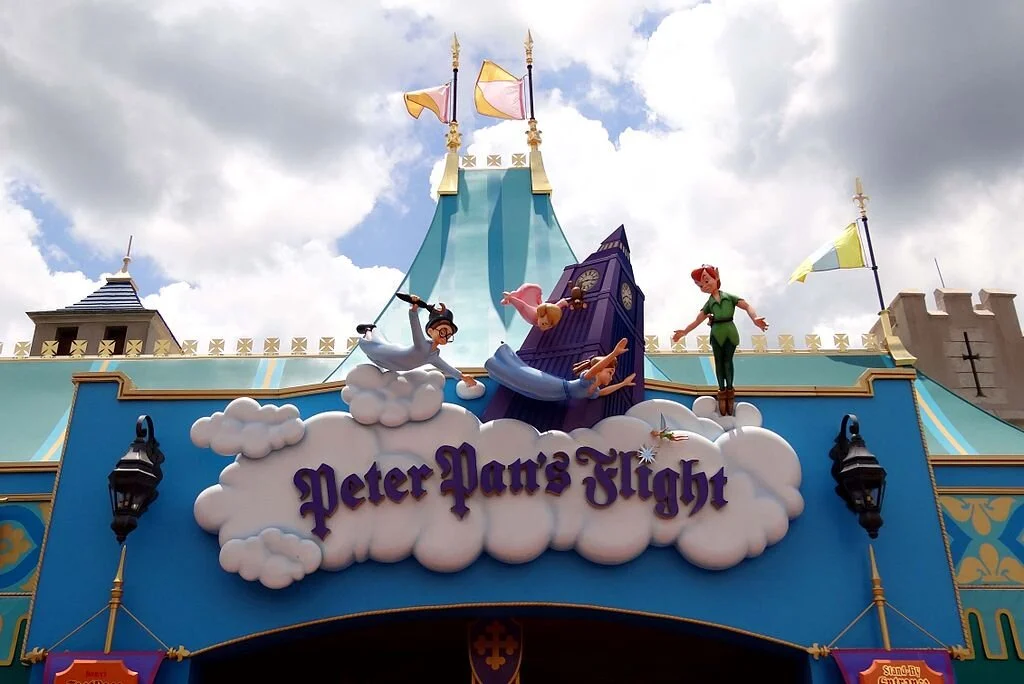
Kjersti Holmang, CC BY-SA 3.0, via Wikimedia Commons
“Here we gooooo!”…to another attraction. This is another one that seems to always have a massive line (37 minutes actually seems like a breeze compared to some 75 minutes wait times it quickly climbs to on busy days). The one upside is that its plussed-up queue might make this wait more pleasant, so use that as a factor when deciding if you’d rather defy the math and venture into Neverland.
Average wait time: 37 minutes
Attraction duration: 3 minutes
ROI: 8.11%
19. Prince Charming Regal Carousel

Jeff Christiansen, CC BY 2.0, via Flickr
While this may be a ride that we chuckle at as adults, some of us can vividly remember riding the carousel on every Disney trip as a wee little nugget of a kid. You have to pick the perfect horse, get hoisted onto the saddle, hold on tight, and try to spot your other parent attempting to take the perfect picture during your wild 2-minute ride. If you have other priorities in the park, maybe skip this one for the low ROI, but if a carousel brings you or your kid some joy, this classic attraction might be worth the memories.
Average wait time: 23 minutes
Attraction duration: 2 minutes
ROI: 8.7%
18. Mad Tea Party
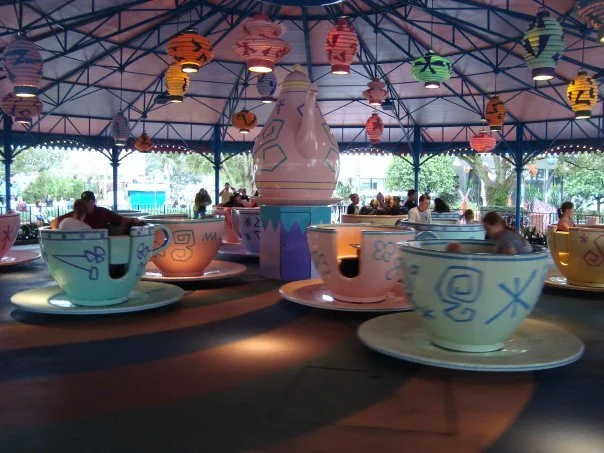
Romulan248, CC BY-SA 3.0, via Wikipedia
Looks like it’s a very unmerry unbirthday for this attraction. Don’t worry, we’ll hold for applause…
It’s another classic that you might constantly avoid to prevent revisiting your lunch, so if you were already happy to stand on the sidelines and wave to your family or friends as they try to hit a top spinning speed (before pulling a muscle - yes that’s happened to us), this might be more reason to sit out.
Average wait time: 15 minutes
Attraction duration: 1.5 minutes
ROI: 10%
17. The Magic Carpets of Aladdin

Michael Gray, CC BY 2.0, via Flickr
As a Dumbo clone, this one was a little surprising to us, but as you’ll see, Dumbo only has a slight bump above this attraction. We could easily see these flip-flop on the list if Dumbo was having a busier day. Maybe Magic Carpets just saw an influx of riders after getting Dole Whips at Aloha Isle that day?
Average wait time: 13 minutes
Attraction duration: 1.5 minutes
ROI: 11.54%
16. Dumbo the Flying Elephant

Wally Gobetz, CC BY-NC-ND 2.0, via Flickr
At 11 minutes, we can’t really complain about this wait - it certainly seems low and might be heavily skewed by low-capacity times. If you’ve got the littlest of kiddos or just have that nostalgia for racing to the purple Dumbo and soaring high above Fantasyland, might still be worth giving this one a go.
Average wait time: 11 minutes
Attraction duration: 1.5 minutes
ROI: 13.64%
15. The Barnstormer

bea & txema from Dublin, Ireland, CC BY 2.0, via Wikimedia Commons
Oh, Goofy…this attraction’s wait time might be a breeze, but this is a very short coaster - clocking in at only 2 minutes. That said, it’s a great entry-coaster for younger ones, so if you’re looking for a test ride before going on Big Thunder, Barnstormer might be your best bet to test those little nerves before graduating to the bigger coasters.
Average wait time: 14 minutes
Attraction duration: 2 minutes
ROI: 14.29%
14. The Many Adventures of Winnie the Pooh

Freddo, CC BY-SA 4.0, via Wikimedia Commons
If you’re a Winnie the Pooh fan, this one might be a must-do no matter what, but if you’re not totally sure what a Heffalump or a Woozle is, this one might not give you the return you’re looking for. Or if you’re a Mr. Toad fan, you could just be avoiding this one completely out of anger and sadness. At least you can visit Toad in the Haunted Mansion pet cemetery?
Average wait time: 24 minutes
Attraction duration: 4 minutes
ROI: 16.67%
13. Jungle Cruise

Josh Hallett, CC BY 2.0, via Flickr
Jungle Cruise has seen incredibly long lines for quite some time and that’s probably not changing with the updates they’re making to the ride and the new movie coming out this summer. Some of us just can’t resist the punniest of pun jokes from those Skippers and will gladly wait for that boat. We’d just maybe recommend a FastPass if you can snatch one up in time.
Average wait time: 46 minutes
Attraction duration: 8 minutes
ROI: 17.39%
12. Pirates of the Caribbean

HarshLight from San Jose, CA, USA, CC BY 2.0, via Wikimedia Commons
“Yo-ho, yo-ho, a 30+ minute wait for me!” This is one attraction that we might just say “throw caution to the wind” for and do the wait. Why you might ask? It’s entirely covered (unless it’s a really busy day) and indoors! Take in the smells, the scenery, and that cool breeze as you make your way down to the docks to live like a pirate for a little over 7 minutes.
Average wait time: 36 minutes
Attraction duration: 7.5 minutes
ROI: 20.83%
11. Buzz Lightyear's Space Ranger Spin
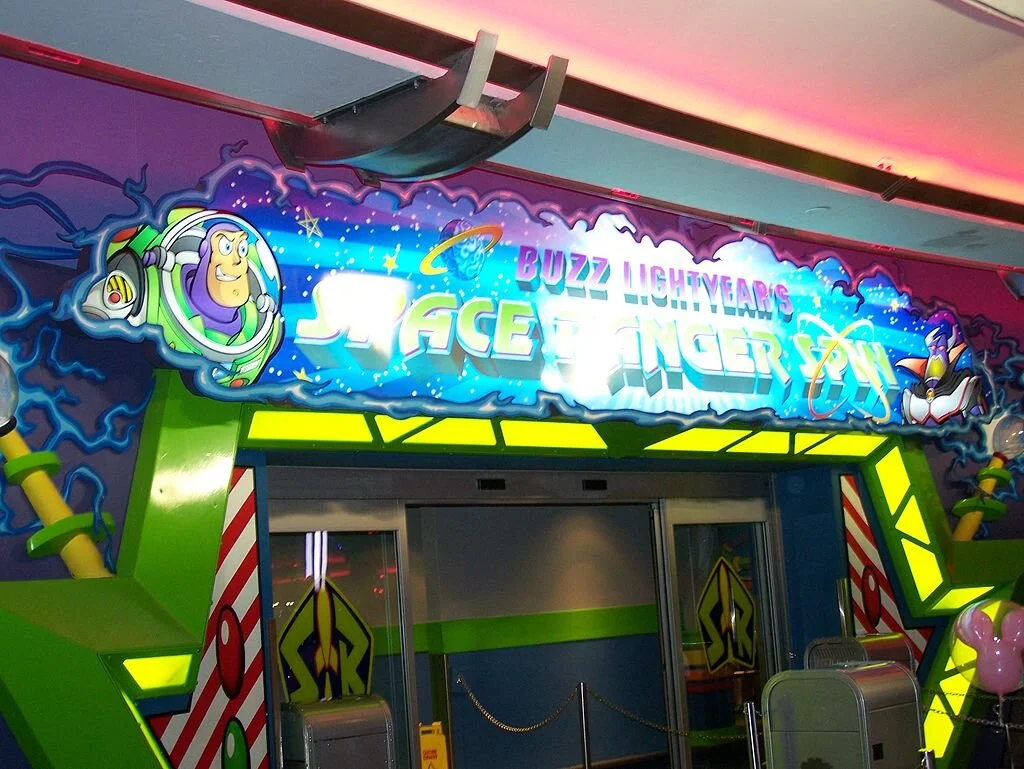
Matt Dempsey from Lorain, Ohio, United States of America, CC BY-SA 2.0, via Wikimedia Commons
This one is tough. Our competitive side says if the line’s about 20 minutes, it might be worth the wait, but 30+ minutes in this queue can be brutal. If you’re not ready for winding corrals with minimal theming (and at least a few stressed-out kiddos near you), maybe loop back later or plan ahead for a FastPass to test your space ranger shooting skills.
Average wait time: 21 minutes
Attraction duration: 4.5 minutes
ROI: 21.43%
10. Space Mountain

Mttbme, CC BY-SA 3.0, via Wikimedia Commons
Space Mountain is a divisive attraction at the World of Commotion. Whether it’s a personal favorite or one that we remembered more fondly as a child, we all can agree that the last half of the queue is a nightmare. Similar to Buzz, whether you go left or right, you’re faced with a pretty boring winding corral until you’re finally ready to hop into those space buckets. But if you’re trying to conquer all four mountains in the Magic Kingdom, this one might still be worth the wait!
Average wait time: 40 minutes
Attraction duration: 10 minutes
ROI: 25%
9. Tomorrowland Speedway

HarshLight from San Jose, CA, USA, CC BY 2.0, via Wikimedia Commons
Alright, real-talk. We can all agree that we need a major plus-up or an entirely new attraction in replacement of Tomorrowland Speedway, right? This one might’ve broken through to the top ten on the ROI list, but we have a hard time recommending this one as a must-do on your Disney trip. If your kiddo’s looking for a chance to finally drive a car at a top speed of 6mph, maybe just hope that this is a walk-on.
Average wait time: 15 minutes
Attraction duration: 4.25 minutes
ROI: 28.33%
8. Splash Mountain

HarshLight from San Jose, CA, USA, CC BY 2.0, via Wikimedia Commons
We’re sure that the wait time for Splash Mountain will stay high as we near those planned refurbishments for the Princess and the Frog update. At a little over 30% ROI, it’s not the best return, but we can see how this is a must on your next trip. Good news: this queue is solid. The outdoor area does wind a bit if it reaches that far out, but nature, scenery, and music make this wait very bearable. Plus, once you get inside the “burrow” the decorations and small scenes will keep your spirits up as you near those log boats.
Average wait time: 57 minutes
Attraction duration: 18 minutes
ROI: 31.58%
7. Big Thunder Mountain

AmaryllisGardener, CC BY-SA 4.0, via Wikimedia Commons
If this wait remained at 22 minutes, we’d say that this one is a no-brainer. But we know from experience, this wait can get long and the queue is so deceptive. You might see that ramp down to the trains and be ready to hop on “the wildest ride in the wilderness!”...and then find yourself in an entirely new room of weaving lines. There are some interactive pieces in this second room like spinning cranks, but boy does it feel cramped. It’s one of our top rides in the Magic Kingdom, but we definitely recommend hopping on when the lines are shorter or ideally, just grab that FastPass.
Average wait time: 22 minutes
Attraction duration: 7 minutes
ROI: 31.82%
6. Under the Sea - Journey of the Little Mermaid

HarshLight from San Jose, CA, USA, CC BY 2.0, via Wikimedia Commons
This one was a surprise! As a dark ride with a longer duration, clocking in at 7 minutes (poor Peter Pan’s a measly 3-minutes long), this one snuck right by us. It’s a little tucked away in Fantasyland and sometimes gets forgotten, so maybe it’s a sleeper hit that you should factor into your next trip if the lines stay fairly low?
Average wait time: 17 minutes
Attraction duration: 7 minutes
ROI: 41.18%
5. "its a small world"

Joe Penniston, CC BY-NC-ND 2.0, via Flickr
“its a small world” seems to live a dual-life. Any time we stroll by this attraction in Fantasyland, it seems to be either an outrageous wait time or a walk-on. At 14 minutes of ride-time, you’re usually getting your money’s worth, but we’re not convinced that anything beyond a 20-25 minute wait is worth this one when you could hopefully come back another time to spot a shorter line. Just remember, it’s a world of laughter, a world of—and it’s stuck in our head. We’re so sorry.
Average wait time: 29 minutes
Attraction duration: 14 minutes
ROI: 48.28%
4. Haunted Mansion

Benjamin D. Esham / Wikimedia Commons, CC BY-SA 3.0 US, via Wikimedia Commons
Can we say just how pleased we were to see this grace the top five of the ROI list? Haunted Mansion topped our own list of Magic Kingdom attractions (see The (Un)official Disney List For Cool Kids Who Like Good Stuff® at the bottom of our last Magic Kingdom attraction podcast episode roundup). From the details in the queue, to the Stretching Room and the full 10 minutes of pure delight we get from this attraction, it’s always going to be a stop during our Disney trip. The average wait time of 19 minutes admittedly seems low for this one, but who are we kidding? We’d wait double to see those happy haunts.
Average wait time: 19 minutes
Attraction duration: 10 minutes
ROI: 52.63%
And now for the top three! Each one of these attractions turned out to have a 100%+ ROI:
3. Tomorrowland Transit Authority

Theme Park Tourist, CC BY 2.0, via Wikimedia Commons
Did we need more fuel to get friends or family onto the PeopleMover? No. Were we happy to see that we can use math to convince people to get on the PeopleMover? Absolutely. Any attempt at describing this attraction to someone unfamiliar with it feels like a lost cause, but it might be the most pleasant 10 minutes you experience in the park that day. Just sit back and let the Tomorrowland Transit Authority whisk you through Tomorrowland to see the castle from a new angle and get small peaks into nearby attractions. We promise it’s worth the time (and the math agrees!)
Average wait time: 9 minutes
Attraction duration: 10 minutes
ROI: 111.11%
2. Mickey's PhilharMagic

Michael Gray, CC BY 2.0, via Flickr
Mickey’s PhilharMagic was a surprise top pick of our own Magic Kingdom attraction list (reaching number 7 on The (Un)official Disney List For Cool Kids Who Like Good Stuff®) and the short to no wait time was certainly a factor. This 3D show is really delightful, with Donald being the star, and 12 minutes inside a cool theater is a blessing on those hot Orlando, Florida days. The math agrees - this one is worth popping into.
Average wait time: 10 minutes
Attraction duration: 12 minutes
ROI: 120%
1. Walt Disney's Carousel of Progress (Best ROI)

SteamFan, CC BY-SA 3.0, via Wikimedia Commons
Here it is, folks: The Carousel of Progress is our top attraction for ROI! Clocking in at a whopping 21 minutes long, this walk-on attraction was bound to grace the top of the list. Since many Disney-goers might not even realize this attraction exists (or is still around after 46 years!), the wait time is less of a queue and more of a “we’ll be ready to let you in when the next show starts”. We might not stop by this one every trip, but it holds some nostalgia in our hearts that we can’t ignore. It truly is a great big beautiful tomorrow, just a dream away.
Average wait time: 5 minutes
Attraction duration: 21 minutes
ROI: 420%
Well, that’s settled, Carousel of Progress is the absolute best use of your time in the Magic Kingdom. We solved it! Thanks, math!
…
In all honestly, like we said, only you (or maybe a Disney travel agent) can craft the best plans for you, your family, or your friends on your next Disney trip. Maybe this just factors into your decisions as you contemplate getting a FastPass for that favorite attraction or testing your luck with wait times.
We’d love to do a breakdown for other Disney parks and really widen our data set, so stay tuned and let us know if you guessed correctly or if your favorite attraction fell short on this list.
UPDATE: We did a 3-weeks-later breakdown for the Magic Kingdom to see how things have changed further into June!
Now excuse us as we figure out how many times we can experience Carousel of Process in a day to maximize our ROI.
“…so 11 hours of park time breaks down to 660 minutes, divided by 21 minutes of ride time, for a maximum of 31 times…”
“Would we lose our minds?”
“Maybe.”
“Only one way to find out!”